
Red flag warnings are issued when weather conditions become hot, dry, and windy. These conditions are ideal for wildfires to start or grow.
Images
Images intro.
Filter Total Items: 66

Red Flag Warning
Red flag warnings are issued when weather conditions become hot, dry, and windy. These conditions are ideal for wildfires to start or grow.

fireForecast.jpg
Fire Danger Forecast Viewer
3 Fire-related Maps
- Wildfire Potential
- Probability of Large Fire
- Probability of Fire Spread
Fire Danger Forecast Viewer
3 Fire-related Maps
- Wildfire Potential
- Probability of Large Fire
- Probability of Fire Spread

Multi-scale fire triangle: Fire growth and complexity (Simplified)
There are three fire-related triangles used to explain fire growth and expansion. The smallest scale "Fire Triangle" factors in oxygen, heat, and fuel. The "Fire Behavior Triangle" factors in topography, fuel, and weather. While the large-scale "Fire Regime Triangle" factors in ignition source, vegetation, and climate.
There are three fire-related triangles used to explain fire growth and expansion. The smallest scale "Fire Triangle" factors in oxygen, heat, and fuel. The "Fire Behavior Triangle" factors in topography, fuel, and weather. While the large-scale "Fire Regime Triangle" factors in ignition source, vegetation, and climate.

Meet a Fire Scientist: Miguel Villarreal, Ph.D.
MEET A FIRE SCIENTIST: Miguel Villarreal, Ph.D.
I study how wildfires affect landscapes and determine ways we can reduce community risk and help the environment recover after a fire.
MEET A FIRE SCIENTIST: Miguel Villarreal, Ph.D.
I study how wildfires affect landscapes and determine ways we can reduce community risk and help the environment recover after a fire.

Postfire debris flows
Fast-moving, highly destructive debris flows triggered by intense rainfall are one of the most dangerous post-fire hazards. The risk of floods and debris flows after fires increases due to vegetation loss and soil exposure. Cases of sudden and deadly debris flow are well documented along the western United States, particularly in Southern California.
Fast-moving, highly destructive debris flows triggered by intense rainfall are one of the most dangerous post-fire hazards. The risk of floods and debris flows after fires increases due to vegetation loss and soil exposure. Cases of sudden and deadly debris flow are well documented along the western United States, particularly in Southern California.

Wildfire Stats
USGS fire science informs land, water, and emergency management decisions. Each year tens of thousands of wildfires cause billions of dollars of damage.
USGS fire science informs land, water, and emergency management decisions. Each year tens of thousands of wildfires cause billions of dollars of damage.

Multi-scale fire triangle: Fire growth and complexity
There are three fire-related triangles used to explain fire growth and expansion. The smallest scale "Fire Triangle" factors in oxygen, heat, and fuel. The "Fire Behavior Triangle" factors in topography, fuel, and weather. While the large-scale "Fire Regime Triangle" factors in ignition source, vegetation, and climate.
There are three fire-related triangles used to explain fire growth and expansion. The smallest scale "Fire Triangle" factors in oxygen, heat, and fuel. The "Fire Behavior Triangle" factors in topography, fuel, and weather. While the large-scale "Fire Regime Triangle" factors in ignition source, vegetation, and climate.

How Hot Are Wildfires?
How hot do wildfires get?
- 570 F degrees - TEMPERATURE AT WHICH WOOD WILL BURST INTO FLAMES
- 2,200 F degrees - TEMPERATURE WILDFIRES COULD REACH IN EXTREME CONDITIONS
How hot do wildfires get?
- 570 F degrees - TEMPERATURE AT WHICH WOOD WILL BURST INTO FLAMES
- 2,200 F degrees - TEMPERATURE WILDFIRES COULD REACH IN EXTREME CONDITIONS

Meet a Fire Scientist: Rachel A. Loehman
MEET A FIRE SCIENTIST: Rachel A Loehman, Ph.D.
I study the complexities between people and nature, particularly the impacts of wildfires on landscapes, habitats, and natural resources
MEET A FIRE SCIENTIST: Rachel A Loehman, Ph.D.
I study the complexities between people and nature, particularly the impacts of wildfires on landscapes, habitats, and natural resources

How Streamgages are Used in Postfire Flood Forecasting
How Streamgages are Used in Postfire Flood Forecasting
Stream data is recorded in real time and posted online.
Stream data include water level, velocity, and turbidity.
During storms, rainfall data is compared to the stream data.
The National Weather Service uses the data to issue flood warnings.
How Streamgages are Used in Postfire Flood Forecasting
Stream data is recorded in real time and posted online.
Stream data include water level, velocity, and turbidity.
During storms, rainfall data is compared to the stream data.
The National Weather Service uses the data to issue flood warnings.

Visual Abstract for Fire Modeling Integration
Workflow for integrating fire behavior modeling into post-fire hazard risk models. QUIC-Fire is a fast, 3-D simulation tool for prescribed fire planning. It can help managers understand the complex and dynamic behavior of wildland fires.
Workflow for integrating fire behavior modeling into post-fire hazard risk models. QUIC-Fire is a fast, 3-D simulation tool for prescribed fire planning. It can help managers understand the complex and dynamic behavior of wildland fires.

3D QUIC-Fire Visualization
Example of a three-dimensional QUIC-Fire simulation. The example site is located in the Dixie Fire, CA. QUIC-Fire is a fast, 3-D simulation tool for prescribed fire planning. It can help managers understand the complex and dynamic behavior of wildland fires.
Example of a three-dimensional QUIC-Fire simulation. The example site is located in the Dixie Fire, CA. QUIC-Fire is a fast, 3-D simulation tool for prescribed fire planning. It can help managers understand the complex and dynamic behavior of wildland fires.

Modeling to Support Proactive Approaches to Wildland Fire
Screen shot visualization of wind direction and velocity from a coupled/fire atmosphere model run of a wildfire (Dude Fire).
Screen shot visualization of wind direction and velocity from a coupled/fire atmosphere model run of a wildfire (Dude Fire).

Screenshot of USGS Wildfire Hazard and Risk Assessment Clearinghouse
Screenshot of the USGS Wildfire Hazard and Risk Assessment Clearinghouse. The clearinghouse provides a description and information about the spatial extent, resolution, fire modeling approach, values considered (assets and resources), and vintage of LANDFIRE and fire dat
Screenshot of the USGS Wildfire Hazard and Risk Assessment Clearinghouse. The clearinghouse provides a description and information about the spatial extent, resolution, fire modeling approach, values considered (assets and resources), and vintage of LANDFIRE and fire dat
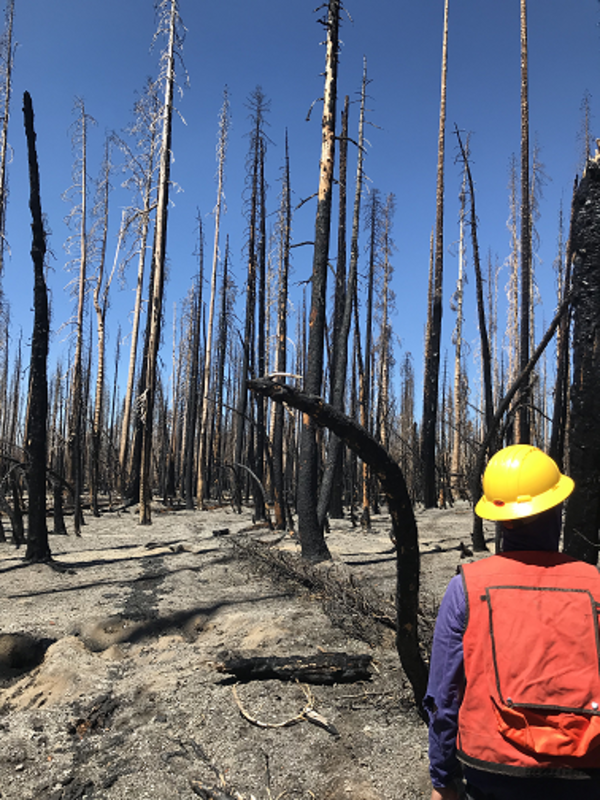
Dixie Fire, Lassen Volcanic National Park, California (2021)
USGS crew measuring forest conditions following the Dixie Fire in 2021. Lassen Volcanic National Park. California.
USGS crew measuring forest conditions following the Dixie Fire in 2021. Lassen Volcanic National Park. California.

Historic Cans
Historic cans from a refuse pile that were scorched by the combustion of nearby fuels during the Caldor Fire, California. Copyright: photo taken by Grant Snitker, New Mexico Consortium.
Historic cans from a refuse pile that were scorched by the combustion of nearby fuels during the Caldor Fire, California. Copyright: photo taken by Grant Snitker, New Mexico Consortium.

Using Terrestrial LiDAR
Using terrestrial LiDAR to characterize fuels within an archaeological site at Sequoia National Park site to understand potential future fire behavior and its effects on artifacts. Copyright: Photo by Grant Snitker, New Mexico Consortium.
Using terrestrial LiDAR to characterize fuels within an archaeological site at Sequoia National Park site to understand potential future fire behavior and its effects on artifacts. Copyright: Photo by Grant Snitker, New Mexico Consortium.

A Precontact Rockshelter and Associated Artifacts
A precontact rockshelter and associated artifacts impacted by the combustion of heavy fuels during the KNP Complex Fire, California. Copyright: photo by Grant Snitker, New Mexico Consortium.
A precontact rockshelter and associated artifacts impacted by the combustion of heavy fuels during the KNP Complex Fire, California. Copyright: photo by Grant Snitker, New Mexico Consortium.

USGS 21st Century Science - WILDLAND FIRE (portrait)
$71-$246 BILLION
Net annual economic impact of wildland fire across the U.S.1
650 MILLION
Acres of public lands that are managed for wildland fire.2
16.1 FATALITIES
Average annual fatalities from wildland fire.3
$71-$246 BILLION
Net annual economic impact of wildland fire across the U.S.1
650 MILLION
Acres of public lands that are managed for wildland fire.2
16.1 FATALITIES
Average annual fatalities from wildland fire.3

I Am A Fire Ecologist - Coloring Page
This is a high resolution image for the whiteboard series I Am A Fire Ecologist - Coloring Page
By
This is a high resolution image for the whiteboard series I Am A Fire Ecologist - Coloring Page
By

Rim Fire in Yosemite National Park.
Rim Fire in Yosemite National Park.