
Map of Fire Island, N.Y. study area
Images
Images intro.
Filter Total Items: 7147

Map of Fire Island, N.Y. study area
Map of Fire Island, N.Y. study area

Study area map of Long Bay, S.C.
Map of Long Bay, S.C. study area

Study area map of coastal South Carolina
Study area map of coastal South Carolina
Study area map of coastal South Carolina

Oceanographic equipment recovery
Oceanographic equipment recovery

Acoustic backscatter and bathymetry maps

Map showing Holocene (modern) sediment thickness
Map showing Holocene (modern) sediment thickness in meters overlain on bathymetry. Regional bathymetric contours are in meters. Note the shoreface-attached sand ridges west of Watch Hill.
Map showing Holocene (modern) sediment thickness in meters overlain on bathymetry. Regional bathymetric contours are in meters. Note the shoreface-attached sand ridges west of Watch Hill.

Map showing the thickness of a relatively young Pleistocene outwash
Map showing the thickness of a relatively young Pleistocene outwash lobe in meters mapped using chirp seismic-reflection profiles collected in 2011, overlain on acoustic backscatter imagery. Regional bathymetric contours are in meters.
Map showing the thickness of a relatively young Pleistocene outwash lobe in meters mapped using chirp seismic-reflection profiles collected in 2011, overlain on acoustic backscatter imagery. Regional bathymetric contours are in meters.

Numerical model grids
Numerical model grids showing downscaling from larger regional grid (far right) to more refined coastal grid (left). Colors are bathymetry (m).
Numerical model grids showing downscaling from larger regional grid (far right) to more refined coastal grid (left). Colors are bathymetry (m).

Deployment period storm analysis.
Deployment period storm analysis. (A) significant wave height (red line) and wind speed and direction (arrows). Shading represents storm type (blue = cold front, red = warm front, yellow = low-pressure). (B) Vertical profiles of suspended-sediment concentration. (C) Cumulative along-shore and cross-shore sediment flux.
Deployment period storm analysis. (A) significant wave height (red line) and wind speed and direction (arrows). Shading represents storm type (blue = cold front, red = warm front, yellow = low-pressure). (B) Vertical profiles of suspended-sediment concentration. (C) Cumulative along-shore and cross-shore sediment flux.

Example of a rip current experiment.
Example of a rip current experiment. Colors show bathymetry and arrows show velocity vectors after 1 h of model simulation. Similar to results in Kumar and others, 2012.
Example of a rip current experiment. Colors show bathymetry and arrows show velocity vectors after 1 h of model simulation. Similar to results in Kumar and others, 2012.

Cleveland Corral landslide in 2011
Toe of the active Cleveland Corral landslide in 2011, perched above US Highway 50 in distance. Movement typically only occurs during wet winter and spring months.
Toe of the active Cleveland Corral landslide in 2011, perched above US Highway 50 in distance. Movement typically only occurs during wet winter and spring months.
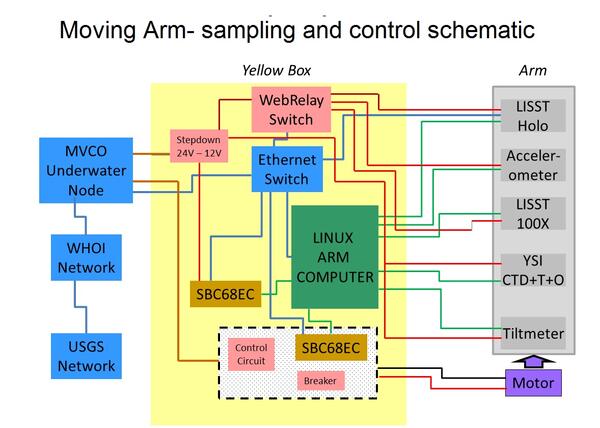
Schematic of system designed to control movement and logging of data
Schematic of system designed to control movement and logging of data collected by the Moving Arm Tripod at Martha's Vineyard Coastal Observatory in 2011.
Schematic of system designed to control movement and logging of data collected by the Moving Arm Tripod at Martha's Vineyard Coastal Observatory in 2011.

Extent of Newberry lavas including approximate ages of surficial flows
Extending approximately 75 miles north to south and 27 miles east to west, Newberry Volcano and its broad apron of lavas (light yellow shaded area) cover a total area of almost 1,200 square miles, making it the largest volcano of the Cascades volcanic chain. Its lavas stretch north beyond Smith Rock State Park, and south almost to Fort Rock State Natural Area.
Extending approximately 75 miles north to south and 27 miles east to west, Newberry Volcano and its broad apron of lavas (light yellow shaded area) cover a total area of almost 1,200 square miles, making it the largest volcano of the Cascades volcanic chain. Its lavas stretch north beyond Smith Rock State Park, and south almost to Fort Rock State Natural Area.

HVO scientist conducts interview at summit of Kīlauea in 2011
Hawaiian Volcano Observatory scientist conducts an interview at the summit of Kīlauea Volcano in 2011.
Hawaiian Volcano Observatory scientist conducts an interview at the summit of Kīlauea Volcano in 2011.

Bathymetry of the New England inner shelf and south shore of Martha’s
Bathymetry of the New England inner shelf and south shore of Martha’s Vineyard with model grids
Bathymetry of the New England inner shelf and south shore of Martha’s Vineyard with model grids

Worldwide distribution of observed and inferred gas hydrates
Worldwide distribution of observed and inferred gas hydrates in marine and permafrost-associated settings that have been the subject of drilling programs. The color coding refers to the primary sediment type in each location and therefore designates the likely type of gas hydrate reservoir at each site.
Worldwide distribution of observed and inferred gas hydrates in marine and permafrost-associated settings that have been the subject of drilling programs. The color coding refers to the primary sediment type in each location and therefore designates the likely type of gas hydrate reservoir at each site.

Public Invited to an Eventful Month of Volcano Awareness
A new fissure eruption in September 2011 on the flank of Pu‘u ‘Ō‘ō on Kīlauea Volcano's east rift zone reminds us of the need to be aware of our ever-changing volcanic environment on Hawai‘i Island. "Volcano Awareness Month" events in January 2012 offer island residents and visitors many opportunities to learn more about Hawai‘i's active volcanoes.
A new fissure eruption in September 2011 on the flank of Pu‘u ‘Ō‘ō on Kīlauea Volcano's east rift zone reminds us of the need to be aware of our ever-changing volcanic environment on Hawai‘i Island. "Volcano Awareness Month" events in January 2012 offer island residents and visitors many opportunities to learn more about Hawai‘i's active volcanoes.

Near-vertical view of lava lake at Halema‘uma‘u
This near-vertical view from the helicopter shows the surface of the lava lake at Halema‘uma‘u.
This near-vertical view from the helicopter shows the surface of the lava lake at Halema‘uma‘u.

Lava continues to enter the ocean at West Ka‘ili‘ili
Lava has continued to enter the ocean at West Ka‘ili‘ili, with numerous entry points scattered along a broad section of the coast. The small boat in the center of the image provides a rough sense of scale.
Lava has continued to enter the ocean at West Ka‘ili‘ili, with numerous entry points scattered along a broad section of the coast. The small boat in the center of the image provides a rough sense of scale.

One of the individual streams of lava cascading over the sea cliff,...
One of the individual streams of lava cascading over the sea cliff, producing a thick steam plume at the water's edge.
One of the individual streams of lava cascading over the sea cliff, producing a thick steam plume at the water's edge.

This skylight provided a clear view of the lava stream inside the l...
This skylight provided a clear view of the lava stream inside the lava tube on today's overflight, and a swiftly moving current could easily be seen.
This skylight provided a clear view of the lava stream inside the lava tube on today's overflight, and a swiftly moving current could easily be seen.