
This is Cindy Hitchcock's staff profile photo, taken during a stream survey. Cindy is a biologist working for the Western Ecological Research Center in Southern California.
Images
Images described and linked on this webpage come from a wide variety of USGS science activities and presentations performed by USGS Science Center staff members in the Region 10: California-Great Basin. A search tool is provided to narrow the number of image files shown.
Filter Total Items: 108

Cindy_Hitchcock_cropped.jpg
This is Cindy Hitchcock's staff profile photo, taken during a stream survey. Cindy is a biologist working for the Western Ecological Research Center in Southern California.

Flowchart showing relations between porphyry copper mining, drought, water resources, and economic effects
linkSchematic flowchart showing relations between porphyry copper mining, drought, water resources, ecosystems, health, and economic factors in the Lower Colorado River Basin and adjoining areas

Producing porphyry copper deposits and porphyry copper prospects in and near the Lower Colorado River Basin
linkMap showing porphyry copper deposits and porphyry copper prospects in and near the Lower Colorado River Basin.
Producing porphyry copper deposits and porphyry copper prospects in and near the Lower Colorado River Basin
linkMap showing porphyry copper deposits and porphyry copper prospects in and near the Lower Colorado River Basin.

RestoreNet Map
RestoreNet is a networked ecological restoration experiment spanning drylands of the American Southwest. It is engaging diverse partners to develop methods for successful revegetation projects that mitigate the effects of drought, invasion by non-native species, and land use practices.
RestoreNet is a networked ecological restoration experiment spanning drylands of the American Southwest. It is engaging diverse partners to develop methods for successful revegetation projects that mitigate the effects of drought, invasion by non-native species, and land use practices.

Graphs showing water-year total precipitation and air temperatures in the Lower Colorado River Basin from 1896 to 2019
linkGraphs showing water-year total precipitation and air temperatures in the Lower Colorado River Basin from 1896 to 2019, units modified from millimeters to inches of precipitation and from degrees Celsius to degrees Fahrenheit from: Tillman, F.D., Gangopadhyay, S., and Pruitt, T., 2020, Trends in recent historical and projected climate data for the Colorado River Bas

Pie chart showing proportions of major water use in Arizona in 2015
Pie chart showing proportions of major water uses (Agricultural, Municipal, Industrial, and Mining) in Arizona, USA, in 2015
Pie chart showing proportions of major water uses (Agricultural, Municipal, Industrial, and Mining) in Arizona, USA, in 2015

Canyonlands Research Center
Scenic view of the red rock mesas surrounding Canyonlands Research Center (The Nature Conservancy) in southern Utah.
Scenic view of the red rock mesas surrounding Canyonlands Research Center (The Nature Conservancy) in southern Utah.

RestoreNet livestock treatments
Cattle inside a grazing enclosure at Canyonlands Research Center (The Nature Conservancy) in southern Utah.
Cattle inside a grazing enclosure at Canyonlands Research Center (The Nature Conservancy) in southern Utah.

A Sonoran Desert RestoreNet site
A RestoreNet Field Trial Network restoration experiment site in the Sonoran Desert, Arizona, in spring 2024. Photo by Laura Shriver (USGS).
A RestoreNet Field Trial Network restoration experiment site in the Sonoran Desert, Arizona, in spring 2024. Photo by Laura Shriver (USGS).

Schematic Diagram of Water Flow for Conventional Flotation Processing of Copper Ores (Bleiwas, 2012)
linkSchematic diagram of water flow for conventional flotation processing of copper ores from Bleiwas, D.I., 2012, Estimated water requirements for the conventional flotation of copper ores: U.S. Geological Survey Open-File Report 2012–1089, 13 p., available at https://pubs.usgs.gov/publication/ofr20121089

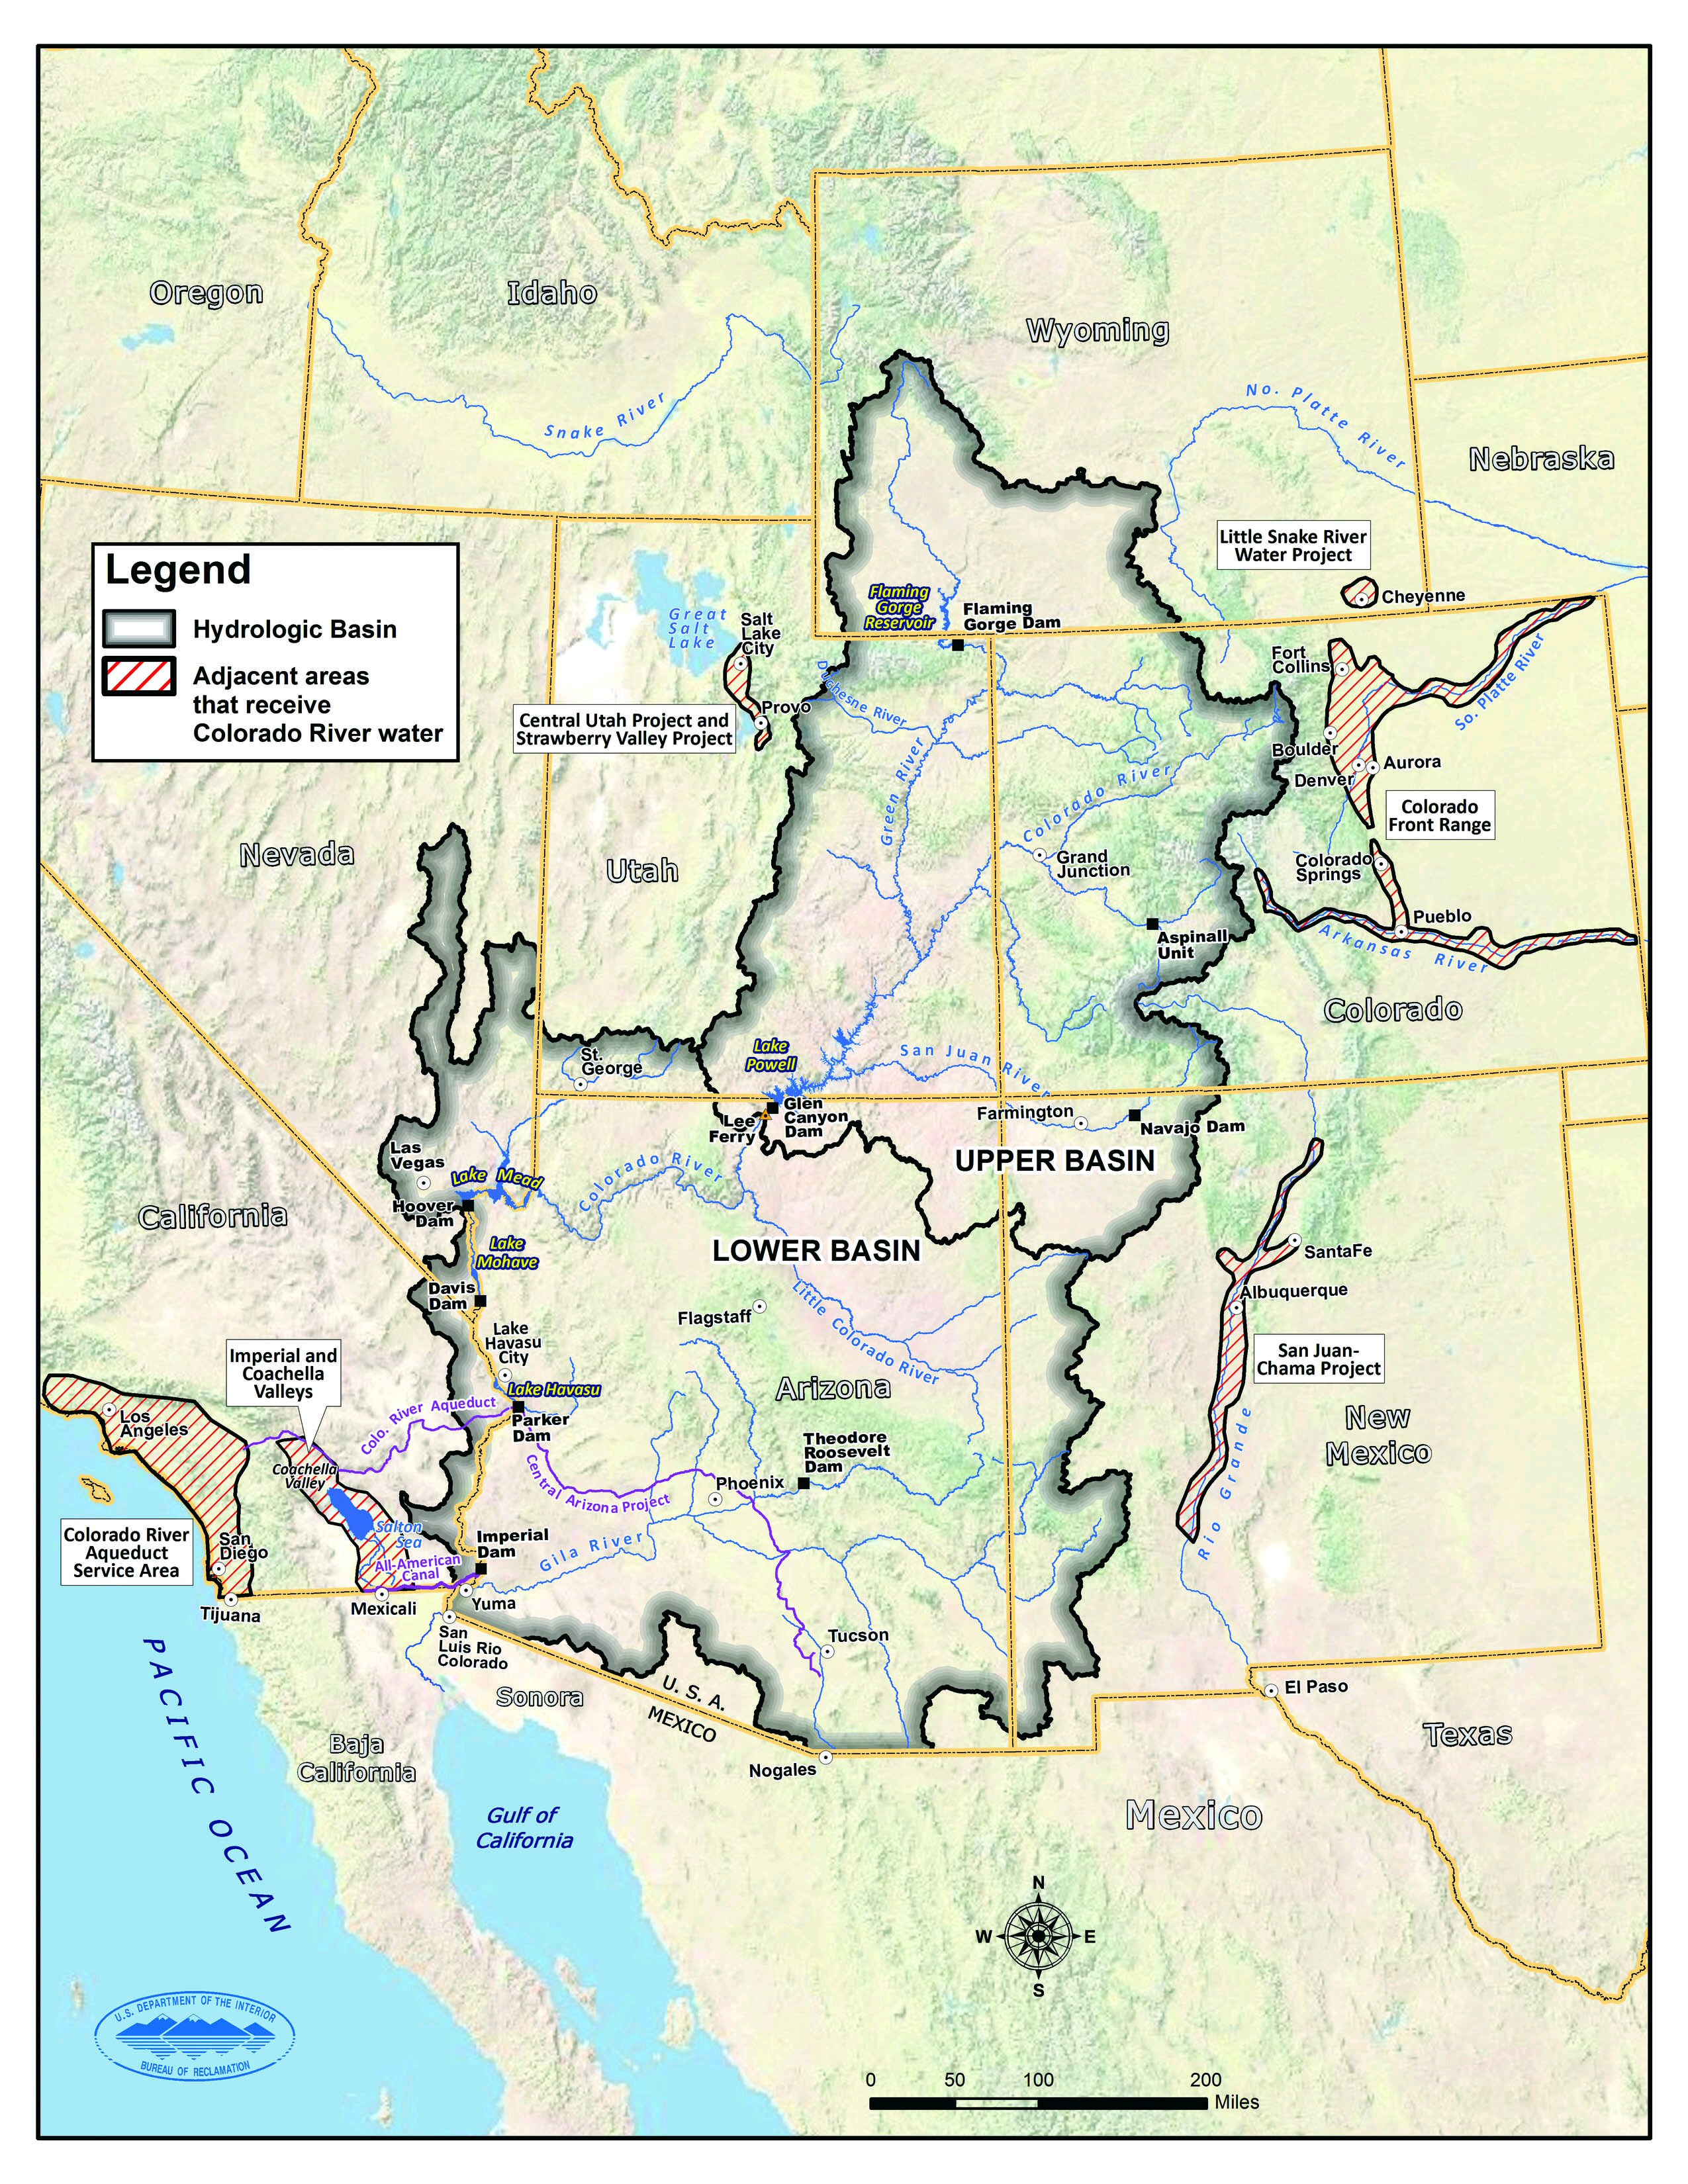
U.S. Bureau of Reclamation Map of the Colorado River Basin
U.S. Bureau of Reclamation map of the Colorado River Basin accessed on October 15, 2024, at URL: CRBSmap.jpg (2550×3300) (usbr.gov)
U.S. Bureau of Reclamation map of the Colorado River Basin accessed on October 15, 2024, at URL: CRBSmap.jpg (2550×3300) (usbr.gov)

Desert marigold (Baileya multiradiata) blooming in a monitoring quadrat at a RestoreNet site
Desert marigold (Baileya multiradiata) blooming in a monitoring quadrat at a RestoreNet site in Northern Arizona. Photo by Laura Shriver (USGS).
Desert marigold (Baileya multiradiata) blooming in a monitoring quadrat at a RestoreNet site in Northern Arizona. Photo by Laura Shriver (USGS).

Attendees of the 6th Federal Uncrewed Systems (UxS) Users Workshop
Aerial photo of attendees at the 6th Federal Uncrewed Systems (UxS) Workshop taken from a Skydio drone in front of the Science and Technology building at the Southwestern Indian Polytechnic Institute, Albuquerque, New Mexico.
Aerial photo of attendees at the 6th Federal Uncrewed Systems (UxS) Workshop taken from a Skydio drone in front of the Science and Technology building at the Southwestern Indian Polytechnic Institute, Albuquerque, New Mexico.

Pie Chart Showing Relative Amounts of Copper Produced in Leading Copper Producing States in 2019
linkPie chart showing relative amounts of copper produced by leading copper producing states in the U.S. in 2019 (derived from data in Flanagan, D.M., 2019, Copper, in Metals and minerals: U.S. Geological Survey Minerals Yearbook 2019, v. 1, p. 20.1-20.30.

coloradoriverbasinviausgs_0 (1).png
Large map of the Colorado River Basin prepared for the USGS Colorado River Basin ASIST Initiative
Large map of the Colorado River Basin prepared for the USGS Colorado River Basin ASIST Initiative

Mean atmospheric precipitation and air temperature in the Lower Colorado River Basin, 1896-2019
linkGraphs showing mean annual precipitation and air temperature trends in the Lower Colorado River Basin, 1896-2019, published in: Tillman, F.D., Gangopadhyay, S., and Pruitt, T., 2020, Trends in recent historical and projected climate data for the Colorado River Basin and potential effects on groundwater availability: U.S.

Colorado_River_Basin_small.jpg
Reduced-size map of the Colorado River Basin from the USGS ASIST Initiative, Sept. 3, 2024
Reduced-size map of the Colorado River Basin from the USGS ASIST Initiative, Sept. 3, 2024

Map of Colorado River Basin
Map of the Colorado River Basin in Wyoming, Colorado, Utah, Nevada, California, Arizona, and New Mexico
Map of the Colorado River Basin in Wyoming, Colorado, Utah, Nevada, California, Arizona, and New Mexico

Long camelthorn rhizomes exposed in a wash at Wupatki National Monument
USGS Biological Science Technician Claudia Dimartini poses with a long camelthorn (Alhagi maurorum) rhizome (underground root structure from which new plants can propagate that was exposed in a wash at the Deadman Wash Confluence Area. Photo by Laura Shriver (USGS).
USGS Biological Science Technician Claudia Dimartini poses with a long camelthorn (Alhagi maurorum) rhizome (underground root structure from which new plants can propagate that was exposed in a wash at the Deadman Wash Confluence Area. Photo by Laura Shriver (USGS).

Soil and restoration science booth at USGS Flagstaff Science Center Open House
Laura Shriver at the soil and restoration science booth at the USGS Flagstaff Science Center Open House. The booth included native seeds, biocrusts, a soil texturing activity, and science brief handouts.
Laura Shriver at the soil and restoration science booth at the USGS Flagstaff Science Center Open House. The booth included native seeds, biocrusts, a soil texturing activity, and science brief handouts.

Celebrating a successful restoration experiment installation
From left to right, Ember Bradbury (Colorado State University), Sarah Costanzo (USGS), Sonoma Brill (USGS), and Laura Shriver (USGS) celebrate installing a RestoreNet site at Canyonlands Research Center near Moab, UT.
From left to right, Ember Bradbury (Colorado State University), Sarah Costanzo (USGS), Sonoma Brill (USGS), and Laura Shriver (USGS) celebrate installing a RestoreNet site at Canyonlands Research Center near Moab, UT.