
USGS employee Keith Lambert during a routine Acoustic Doppler Velocimeter measurement at USGS gage 2055100 Tinker Creek near Daleville, VA.
Images
Explore water-related photography, imagery, and illustrations.
Filter Total Items: 2402

USGS Employee During A Routine Measurement At USGS Gage 2055100, VA
USGS employee Keith Lambert during a routine Acoustic Doppler Velocimeter measurement at USGS gage 2055100 Tinker Creek near Daleville, VA.

Columbia River in Portland, OR, with Mt. Hood
The Columbia River flows by the highway on its way to the Pacific Ocean.
The Columbia River flows by the highway on its way to the Pacific Ocean.

USGS streamgage measures flooding in the lower Trinity River
A USGS streamgage measures flooding in the lower Trinity River, Texas.
A USGS streamgage measures flooding in the lower Trinity River, Texas.

ModelMuse: Farm Process
Screen capture of ModelMuse with the caption "The farm process also requires the modeler define the properties of the farms."
Screen capture of ModelMuse with the caption "The farm process also requires the modeler define the properties of the farms."

WBS Sampling Under Ice
Icy Sampling
RML scientist, Adam Mumford, working under ice to obtain grab samples of a stream in North Dakota to assess impacts of a brine spill from unconventional oil and gas activities (UOG). UOG spills often have very high concentrations of salts, metals, naturally occurring radioactive materials (NORMs), and organic compounds.

Centrifuge Bowl Containing River Suspended Sediment for Analysis
A U.S. Geological Survey hydrologist holds a centrifuge bowl containing river suspended sediment for analysis of metals and organic chemicals. The sample was collected using a new in-field continuous-flow centrifugation technique to separate and collect suspended sediment from large volumes of water.
A U.S. Geological Survey hydrologist holds a centrifuge bowl containing river suspended sediment for analysis of metals and organic chemicals. The sample was collected using a new in-field continuous-flow centrifugation technique to separate and collect suspended sediment from large volumes of water.

A chain-link fence encloses a public-supply well.
A large-volume public supply well in San Antonio, Texas. This well is being sampled for water-quality constituents as part of the NAWQA Enhanced Trend Network project.
A large-volume public supply well in San Antonio, Texas. This well is being sampled for water-quality constituents as part of the NAWQA Enhanced Trend Network project.
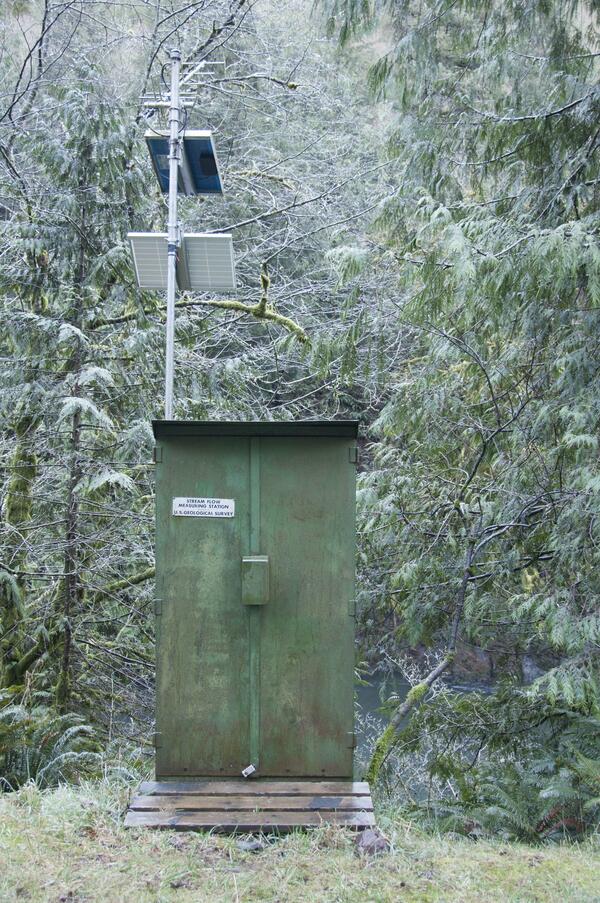
A USGS streamflow gaging station is used to collect water data
A U.S. Geological Survey streamflow gaging station collects water data on the Trask River. The Trask River gage is located near Tillamook, Ore. and has been in operation for 17 years.
A U.S. Geological Survey streamflow gaging station collects water data on the Trask River. The Trask River gage is located near Tillamook, Ore. and has been in operation for 17 years.

USGS streamgage on the Trask River
Trask River stage, discharge, and water-quality data are collected and used together to help monitor the current health of the river. Data from the river are sent to equipment in the gage house, where it is stored then transmitted to USGS servers.
Trask River stage, discharge, and water-quality data are collected and used together to help monitor the current health of the river. Data from the river are sent to equipment in the gage house, where it is stored then transmitted to USGS servers.

Little Plover River Wells
Both irrigation wells and municipal wells affect water levels in the Little Plover River, Wisconsin.
Both irrigation wells and municipal wells affect water levels in the Little Plover River, Wisconsin.

3DEP, lidar point cloud, Denver
A 3D Elevation Program lidar point cloud showing simulated flooding (in blue) of an area in Denver, Colorado
A 3D Elevation Program lidar point cloud showing simulated flooding (in blue) of an area in Denver, Colorado

Sampling a private well in Lycoming County, Pennsylvania
Brian Selck, a USGS National Association of Geoscience Teachers intern, collects a water level measurement from a domestic well at a site north of Jersey Shore in Lycoming County, Pennsylvania, June 2014.
Brian Selck, a USGS National Association of Geoscience Teachers intern, collects a water level measurement from a domestic well at a site north of Jersey Shore in Lycoming County, Pennsylvania, June 2014.

Garden Wall Weather Station, MT
The Garden Wall Weather Station is situated below the Garden Wall and adjacent to the Haystack Creek avalanche path in Glacier National Park. It provides meteorological data for avalanche forecasting and research, including wind speed and direction, air temperature, relative humidity, and net radiation measurements.
The Garden Wall Weather Station is situated below the Garden Wall and adjacent to the Haystack Creek avalanche path in Glacier National Park. It provides meteorological data for avalanche forecasting and research, including wind speed and direction, air temperature, relative humidity, and net radiation measurements.

Public supply well and aerator
Anoxic groundwater pumped from the embayment-uplands aquifers for municipal supply is oxygenated as it cascades over aerator trays. The iron and manganese that are dissolved in the water precipitate and are filtered from the water.
Anoxic groundwater pumped from the embayment-uplands aquifers for municipal supply is oxygenated as it cascades over aerator trays. The iron and manganese that are dissolved in the water precipitate and are filtered from the water.

Using Gmsh to generate a mesh
Screen capture of ModelMuse with a mesh for SUTRA being generated by GMSH. This image is intended to be used as a thumbnail for a video.
Screen capture of ModelMuse with a mesh for SUTRA being generated by GMSH. This image is intended to be used as a thumbnail for a video.

USGS hydrologic technician Amy Simonson measuring floodwaters at East Meadow Brook at Freeport NY

Lone Star Geyser, Yellowstone National Park
eruption of Lone Star Geyser, Yellowstone National Park
eruption of Lone Star Geyser, Yellowstone National Park

SWR Overview
Screen capture of ModelMuse with an object used in Surface Water Routing and the words "Now I've set up a very simple Surface Water Routing process model.
Screen capture of ModelMuse with an object used in Surface Water Routing and the words "Now I've set up a very simple Surface Water Routing process model.

SWR Other Spatial Data
Screen capture of the ModelMuse "MODFLOW Packages and Programs" dialog box with the words "In the Surface Water Routing process, there are two different ways to specify rainfall, evaportation, lateral inflow, and stage."
Screen capture of the ModelMuse "MODFLOW Packages and Programs" dialog box with the words "In the Surface Water Routing process, there are two different ways to specify rainfall, evaportation, lateral inflow, and stage."

SWR Nonspatial Data
Screen capture of the ModelMuse "MODFLOW Packages and Programs" dialog box with the Surface-Water Routing process selected.
Screen capture of the ModelMuse "MODFLOW Packages and Programs" dialog box with the Surface-Water Routing process selected.

SWR Results
Screen capture of ModelMuse with the Data Visualization dialog box open to "SWR Observations".
Screen capture of ModelMuse with the Data Visualization dialog box open to "SWR Observations".