
A landscape at Whiskeytown National Recreation Area 2 months after summer 2018's Carr Fire near Redding, California, where USGS WERC researchers are studying fire impacts, post-fire vegetation recovery, and post-fire erosion and debris flows.
Images
Total: 0
Settings
Total: 0
Explore our planet through photography and imagery, including climate change and water all the way back to the 1800s when the USGS was surveying the country by horse and buggy.
Filter Total Items: 21537

Hillside at Whiskeytown National Recreation Area 2 Months After Fire
A landscape at Whiskeytown National Recreation Area 2 months after summer 2018's Carr Fire near Redding, California, where USGS WERC researchers are studying fire impacts, post-fire vegetation recovery, and post-fire erosion and debris flows.
A landscape at Whiskeytown National Recreation Area 2 months after summer 2018's Carr Fire near Redding, California, where USGS WERC researchers are studying fire impacts, post-fire vegetation recovery, and post-fire erosion and debris flows.

Landscape at Whiskeytown National Recreation Area 2 Months After Fire
A landscape at Whiskeytown National Recreation Area 2 months after summer 2018's Carr Fire near Redding, California, where USGS WERC researchers are studying fire impacts, post-fire vegetation recovery, and post-fire erosion and debris flows.
A landscape at Whiskeytown National Recreation Area 2 months after summer 2018's Carr Fire near Redding, California, where USGS WERC researchers are studying fire impacts, post-fire vegetation recovery, and post-fire erosion and debris flows.

Looking at the ocean through the bottom of a plane
Looking through the belly port of a small airplane before an aerial photographic survey starts, Fall 2018.
The Seabird Studies Team at the USGS Western Ecological Research Center is conducting aerial photographic surveys of the ocean off central and southern California to create comprehensive maps of seabird and marine mammal distributions.

Mapping nearshore depths along a beach
Cordell Johnson uses a personal watercraft (PWC) equipped with GPS and sonar to measure seafloor depths near the beach.
Cordell Johnson uses a personal watercraft (PWC) equipped with GPS and sonar to measure seafloor depths near the beach.

One of the geothermal seeps that flows into the Yellowstone River
View of one of the geothermal seeps that flows into the Yellowstone River south of LaDuke Hot Spring.
View of one of the geothermal seeps that flows into the Yellowstone River south of LaDuke Hot Spring.

Preparing for data collection on a aerial photographic survey
While still over land, Biological Technician, Amelia DuVall prepares the computer for data collection at the beginning of an aerial photographic survey.
While still over land, Biological Technician, Amelia DuVall prepares the computer for data collection at the beginning of an aerial photographic survey.

FPI Forecast
Fire Potential Index map for October 10, 2018.
Fire Potential Index map for October 10, 2018.

Measuring dune elevations
Dan Nowacki measures dune elevations near the mouth of the Pajaro River with a precision GPS unit carried in his backpack.
Dan Nowacki measures dune elevations near the mouth of the Pajaro River with a precision GPS unit carried in his backpack.

New Gulf of Mexico network speeds USGS hurricane preparations
Each one these blue dots represents a site where a storm-tide sensor bracket has been installed for the Gulf of Mexico pre-defined network. There are currently 85 brackets in Florida, 6 in Alabama, 3 in Mississippi, 18 in Louisiana and 26 in Texas, for a total of 138 bracketed sites. (Not all brackets will be used in all storms.)
Each one these blue dots represents a site where a storm-tide sensor bracket has been installed for the Gulf of Mexico pre-defined network. There are currently 85 brackets in Florida, 6 in Alabama, 3 in Mississippi, 18 in Louisiana and 26 in Texas, for a total of 138 bracketed sites. (Not all brackets will be used in all storms.)

Staff from NYSDEC and volunteers release 2,500 lake sturgeon into Cayu
Staff from NYSDEC and volunteers release 2,500 lake sturgeon into Cayuga Lake.
Staff from NYSDEC and volunteers release 2,500 lake sturgeon into Cayuga Lake.

Sunrise at Mount St. Helens
The sun rises at Mount St. Helens (pictured in the distance), with low-level clouds covering Coldwater Lake. The view is from the Coldwater Science and Learning Center, the site of the 2018 GeoGirls field camp program.
The sun rises at Mount St. Helens (pictured in the distance), with low-level clouds covering Coldwater Lake. The view is from the Coldwater Science and Learning Center, the site of the 2018 GeoGirls field camp program.

This Flood Event Viewer is a one-stop information source
The USGS creates a Flood Event Viewer for major flooding incidents, as a one-stop, interactive information source. On that website, viewers can click on each red dot (storm-tide sensor) to see details about it.
The USGS creates a Flood Event Viewer for major flooding incidents, as a one-stop, interactive information source. On that website, viewers can click on each red dot (storm-tide sensor) to see details about it.

Fish Inn, the scientists' field station, before Hurricane Michael
For ten years, this yellow concrete block house in Cape San Blas, Florida, dubbed Fish Inn, was the seasonal office, laboratory and living quarters for a team of USGS sea turtle researchers during their field season from November till April.
For ten years, this yellow concrete block house in Cape San Blas, Florida, dubbed Fish Inn, was the seasonal office, laboratory and living quarters for a team of USGS sea turtle researchers during their field season from November till April.

N. Cheung leaving Rockway Inlet NY tide station
Northeast Region Photo Contest Winner | November 2018 | USGS at Work
N. Cheung leaving Rockway Inlet NY tide station
Northeast Region Photo Contest Winner | November 2018 | USGS at Work
N. Cheung leaving Rockway Inlet NY tide station

Strong hurricane impacts predicted for many Panhandle beaches
Coastal Change Storm Hazard Team map created Tuesday, 10/89/18 showing current forecasted beach erosion, overwash and inundation effects of Hurricane Michael's predicted landfall in the Florida Panhandle. Forecast will change with subsequent National Hurricane Center forecasts.
Coastal Change Storm Hazard Team map created Tuesday, 10/89/18 showing current forecasted beach erosion, overwash and inundation effects of Hurricane Michael's predicted landfall in the Florida Panhandle. Forecast will change with subsequent National Hurricane Center forecasts.

USGS ecologists prepare for a drone flight over a burn area
USGS ecologist and drone pilot Chase Freeman and technician Kylie Mosher prepare for a drone flight at Whiskeytown National Recreation Area.
USGS ecologist and drone pilot Chase Freeman and technician Kylie Mosher prepare for a drone flight at Whiskeytown National Recreation Area.

Volunteers mark lake sturgeon at the NYSDEC Oneida Hatchery
Volunteers mark lake sturgeon at the NYSDEC Oneida Hatchery
Volunteers mark lake sturgeon at the NYSDEC Oneida Hatchery
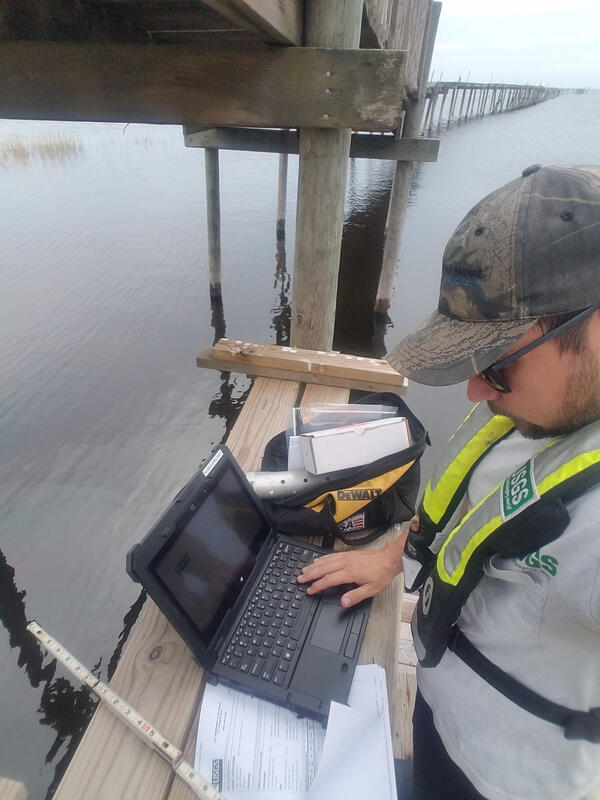
A USGS hydrographer multi-tasking as he installs storm-tide sensors
Brett Johnston, USGS hydrographer, enters storm-tide sensor information into a USGS data management system on October 8 near Fish Creek, Florida. USGS Photo by Brett Johnston.
Brett Johnston, USGS hydrographer, enters storm-tide sensor information into a USGS data management system on October 8 near Fish Creek, Florida. USGS Photo by Brett Johnston.

Collecting flood data on the Llano River in response to a flash flood
USGS scientist Scott Grzyb reviews high-water data collected by boat on the Llano River in Llano, Texas in response to a flash flood on October 8, 2018.
USGS scientist Scott Grzyb reviews high-water data collected by boat on the Llano River in Llano, Texas in response to a flash flood on October 8, 2018.

End of a long day collecting flood data on the Llano River
USGS scientists Scrott Grzyb and Michael Scheider pause at sunset at the end of a long day collecting high-water measurements along the Llano River on October 8, 2018.
USGS scientists Scrott Grzyb and Michael Scheider pause at sunset at the end of a long day collecting high-water measurements along the Llano River on October 8, 2018.